Home Compare
GPU Benchmarks NVIDIA RTX 2080 Ti vs. NVIDIA Titan RTX
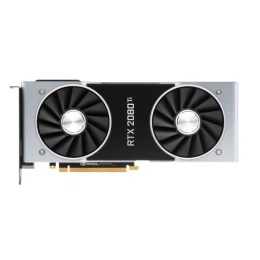
NVIDIA RTX 2080 Ti
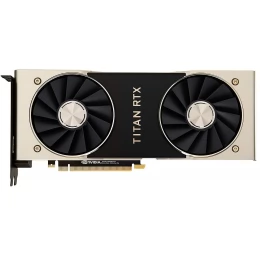
NVIDIA Titan RTX
NVIDIA Quadro RTX 6000
NVIDIA Quadro RTX 8000
NVIDIA GTX 1080 Ti
NVIDIA Titan V
NVIDIA Tesla V100
NVIDIA GTX 780
NVIDIA GTX 780 Ti
NVIDIA GTX 960
NVIDIA GTX 980
NVIDIA GTX 980 Ti
NVIDIA GTX 1050
NVIDIA GTX 1050 Ti
NVIDIA GTX 1060
NVIDIA GTX 1070
NVIDIA GTX 1070 Ti
NVIDIA GTX 1080
NVIDIA GTX 1650
NVIDIA GTX 1660
NVIDIA GTX 1660 Ti
NVIDIA RTX 2060
NVIDIA RTX 2060 Super
NVIDIA RTX 2070
NVIDIA RTX 2070 Super
NVIDIA RTX 2080
NVIDIA RTX 2080 Super
NVIDIA Titan Xp
NVIDIA Quadro M6000
NVIDIA Quadro P1000
NVIDIA Quadro P2000
NVIDIA Quadro P4000
NVIDIA Quadro P5000
NVIDIA Quadro P6000
NVIDIA Quadro GP100
NVIDIA Quadro GV100
NVIDIA Quadro RTX 4000
NVIDIA Quadro RTX 5000
NVIDIA RTX 3070
NVIDIA RTX 3080
NVIDIA RTX 3090
NVIDIA RTX A6000
NVIDIA RTX 3060
NVIDIA RTX 3060 Ti
NVIDIA A100 40 GB (PCIe)
NVIDIA A40
NVIDIA A10
NVIDIA A16
NVIDIA A30
NVIDIA RTX A4000
NVIDIA RTX A5000
NVIDIA RTX 3070 Ti
NVIDIA RTX 3080 Ti
NVIDIA A100 80 GB (PCIe)
NVIDIA A100 80 GB (SXM4)
NVIDIA RTX A4500
NVIDIA T400
NVIDIA T600
NVIDIA T1000
NVIDIA RTX A5500
NVIDIA RTX A2000
NVIDIA H100 NVL (PCIe)
NVIDIA H100 NVL (SXM5)
NVIDIA H100 CNX
NVIDIA RTX 3090 Ti
NVIDIA RTX 4090
NVIDIA RTX 4080
NVIDIA RTX 4070 Ti
NVIDIA RTX 6000 Ada
NVIDIA L40
NVIDIA RTX 4090 Ti (Unreleased)
NVIDIA RTX 4000 SFF Ada
NVIDIA RTX 4070
NVIDIA L40s
NVIDIA RTX 4000 Ada
NVIDIA RTX 4500 Ada
NVIDIA RTX 5000 Ada
NVIDIA A800 40 GB (PCIe)
NVIDIA A800 40 GB Active
NVIDIA H200 NVL (SXM5)
NVIDIA GH200
NVIDIA L4
NVIDIA B200 (SXM)
NVIDIA RTX 5090
NVIDIA H200 NVL (PCIe)
NVIDIA RTX 5080
NVIDIA RTX 5070 Ti
NVIDIA RTX 5070
NVIDIA RTX 5060 Ti
NVIDIA RTX 5060
NVIDIA RTX PRO 6000 Blackwell Server
NVIDIA RTX PRO 6000 Blackwell
NVIDIA RTX PRO 6000 Blackwell Max-Q
NVIDIA RTX PRO 5000 Blackwell
NVIDIA RTX PRO 4500 Blackwell
NVIDIA RTX PRO 4000 Blackwell
AMD Radeon RX 9070 XT
AMD Radeon Instinct MI300
AMD Radeon Instinct MI300X
AMD Radeon Instinct MI325X
NVIDIA RTX 2080 Ti
X
VS
NVIDIA RTX 2080 Ti
NVIDIA Titan RTX
NVIDIA Quadro RTX 6000
NVIDIA Quadro RTX 8000
NVIDIA GTX 1080 Ti
NVIDIA Titan V
NVIDIA Tesla V100
NVIDIA GTX 780
NVIDIA GTX 780 Ti
NVIDIA GTX 960
NVIDIA GTX 980
NVIDIA GTX 980 Ti
NVIDIA GTX 1050
NVIDIA GTX 1050 Ti
NVIDIA GTX 1060
NVIDIA GTX 1070
NVIDIA GTX 1070 Ti
NVIDIA GTX 1080
NVIDIA GTX 1650
NVIDIA GTX 1660
NVIDIA GTX 1660 Ti
NVIDIA RTX 2060
NVIDIA RTX 2060 Super
NVIDIA RTX 2070
NVIDIA RTX 2070 Super
NVIDIA RTX 2080
NVIDIA RTX 2080 Super
NVIDIA Titan Xp
NVIDIA Quadro M6000
NVIDIA Quadro P1000
NVIDIA Quadro P2000
NVIDIA Quadro P4000
NVIDIA Quadro P5000
NVIDIA Quadro P6000
NVIDIA Quadro GP100
NVIDIA Quadro GV100
NVIDIA Quadro RTX 4000
NVIDIA Quadro RTX 5000
NVIDIA RTX 3070
NVIDIA RTX 3080
NVIDIA RTX 3090
NVIDIA RTX A6000
NVIDIA RTX 3060
NVIDIA RTX 3060 Ti
NVIDIA A100 40 GB (PCIe)
NVIDIA A40
NVIDIA A10
NVIDIA A16
NVIDIA A30
NVIDIA RTX A4000
NVIDIA RTX A5000
NVIDIA RTX 3070 Ti
NVIDIA RTX 3080 Ti
NVIDIA A100 80 GB (PCIe)
NVIDIA A100 80 GB (SXM4)
NVIDIA RTX A4500
NVIDIA T400
NVIDIA T600
NVIDIA T1000
NVIDIA RTX A5500
NVIDIA RTX A2000
NVIDIA H100 NVL (PCIe)
NVIDIA H100 NVL (SXM5)
NVIDIA H100 CNX
NVIDIA RTX 3090 Ti
NVIDIA RTX 4090
NVIDIA RTX 4080
NVIDIA RTX 4070 Ti
NVIDIA RTX 6000 Ada
NVIDIA L40
NVIDIA RTX 4090 Ti (Unreleased)
NVIDIA RTX 4000 SFF Ada
NVIDIA RTX 4070
NVIDIA L40s
NVIDIA RTX 4000 Ada
NVIDIA RTX 4500 Ada
NVIDIA RTX 5000 Ada
NVIDIA A800 40 GB (PCIe)
NVIDIA A800 40 GB Active
NVIDIA H200 NVL (SXM5)
NVIDIA GH200
NVIDIA L4
NVIDIA B200 (SXM)
NVIDIA RTX 5090
NVIDIA H200 NVL (PCIe)
NVIDIA RTX 5080
NVIDIA RTX 5070 Ti
NVIDIA RTX 5070
NVIDIA RTX 5060 Ti
NVIDIA RTX 5060
NVIDIA RTX PRO 6000 Blackwell Server
NVIDIA RTX PRO 6000 Blackwell
NVIDIA RTX PRO 6000 Blackwell Max-Q
NVIDIA RTX PRO 5000 Blackwell
NVIDIA RTX PRO 4500 Blackwell
NVIDIA RTX PRO 4000 Blackwell
AMD Radeon RX 9070 XT
AMD Radeon Instinct MI300
AMD Radeon Instinct MI300X
AMD Radeon Instinct MI325X
NVIDIA Titan RTX
X
+
Quick links:
Best GPUs for deep learning, AI development, compute in 2023–2024. Recommended GPU & hardware for AI training, inference (LLMs, generative AI).
GPU training, inference benchmarks using PyTorch, TensorFlow for computer vision (CV), NLP, text-to-speech, etc.
We benchmark NVIDIA RTX 2080 Ti vs NVIDIA Titan RTX GPUs and compare AI performance (deep learning training; FP16, FP32, PyTorch, TensorFlow), 3d rendering, Cryo-EM performance in the most popular apps (Octane, VRay, Redshift, Blender, Luxmark, Unreal Engine, Relion Cryo-EM).
Our benchmarks will help you decide which GPU (NVIDIA RTX 4090/4080, H100 Hopper, H200, A100, RTX 6000 Ada, A6000, A5000, or RTX 6000 ADA Lovelace) is the best GPU for your needs. We provide an in-depth analysis of the AI performance of each graphic card's performance so you can make the most informed decision possible. We offer deep learning and 3d rendering benchmarks that will help you get the most out of your hardware.
Looking for a GPU workstation or server for AI/ML, design, rendering, simulation or molecular dynamics? AI workstations or GPU servers .Contact us today or explore our various customizable AI solutions.
Featured GPU benchmarks:
Deep Learning GPU Benchmarks 2024–2025 [Updated]↑ As of April 2025
Resnet50 (FP16) 1 GPU
NVIDIA RTX 2080 Ti
488.56 points
NVIDIA Titan RTX
599.29 points
4 GPU
NVIDIA RTX 2080 Ti
1597.66 points
NVIDIA Titan RTX
1793.02 points
Resnet50 (FP16 XLA) 1 GPU
NVIDIA RTX 2080 Ti
741.26 points
NVIDIA Titan RTX
938.63 points
4 GPU
NVIDIA RTX 2080 Ti
2465.23 points
NVIDIA Titan RTX
3015.66 points
Resnet50 (FP32) 1 GPU
NVIDIA RTX 2080 Ti
302.88 points
NVIDIA Titan RTX
330.9 points
4 GPU
NVIDIA RTX 2080 Ti
1075.19 points
NVIDIA Titan RTX
1111.27 points
Resnet50 (FP32 XLA) 1 GPU
NVIDIA RTX 2080 Ti
330.72 points
NVIDIA Titan RTX
364.35 points
4 GPU
NVIDIA RTX 2080 Ti
1132.16 points
NVIDIA Titan RTX
1231.15 points
Resnet152 (FP16) 1 GPU
NVIDIA RTX 2080 Ti
213.35 points
NVIDIA Titan RTX
267.62 points
4 GPU
NVIDIA RTX 2080 Ti
681.19 points
NVIDIA Titan RTX
751.47 points
Resnet152 (FP16 XLA) 1 GPU
NVIDIA RTX 2080 Ti
290.23 points
NVIDIA Titan RTX
369.05 points
4 GPU
NVIDIA RTX 2080 Ti
977.06 points
NVIDIA Titan RTX
1205.22 points
Resnet152 (FP32) 1 GPU
NVIDIA Titan RTX
139.43 points
4 GPU
NVIDIA Titan RTX
450.18 points
Resnet152 (FP32 XLA) 1 GPU
NVIDIA Titan RTX
147.6 points
4 GPU
NVIDIA Titan RTX
502.34 points
Inception V3 (FP16) 1 GPU
NVIDIA RTX 2080 Ti
293.76 points
NVIDIA Titan RTX
374 points
4 GPU
NVIDIA RTX 2080 Ti
1031 points
NVIDIA Titan RTX
1226.21 points
Inception V3 (FP16 XLA) 1 GPU
NVIDIA RTX 2080 Ti
404.99 points
NVIDIA Titan RTX
543.32 points
4 GPU
NVIDIA RTX 2080 Ti
1467.97 points
NVIDIA Titan RTX
1901.16 points
Inception V3 (FP32) 1 GPU
NVIDIA RTX 2080 Ti
198.81 points
NVIDIA Titan RTX
226.3 points
4 GPU
NVIDIA RTX 2080 Ti
739.49 points
NVIDIA Titan RTX
814.29 points
Inception V3 (FP32 XLA) 1 GPU
NVIDIA RTX 2080 Ti
215.54 points
NVIDIA Titan RTX
244.12 points
4 GPU
NVIDIA RTX 2080 Ti
772.66 points
NVIDIA Titan RTX
967.93 points
Inception V4 (FP16) 1 GPU
NVIDIA RTX 2080 Ti
155.84 points
NVIDIA Titan RTX
200.71 points
4 GPU
NVIDIA RTX 2080 Ti
564.62 points
NVIDIA Titan RTX
664.39 points
Inception V4 (FP16 XLA) 1 GPU
NVIDIA RTX 2080 Ti
220.7 points
NVIDIA Titan RTX
298.5 points
4 GPU
NVIDIA RTX 2080 Ti
790.82 points
NVIDIA Titan RTX
1042.2 points
Inception V4 (FP32) 1 GPU
NVIDIA Titan RTX
111.56 points
4 GPU
NVIDIA Titan RTX
394.81 points
Inception V4 (FP32 XLA) 1 GPU
NVIDIA Titan RTX
118.83 points
4 GPU
NVIDIA Titan RTX
427.81 points
VGG16 (FP16) 1 GPU
NVIDIA RTX 2080 Ti
264.14 points
NVIDIA Titan RTX
366.59 points
4 GPU
NVIDIA RTX 2080 Ti
578.14 points
NVIDIA Titan RTX
518.28 points
VGG16 (FP16 XLA) 1 GPU
NVIDIA RTX 2080 Ti
324.85 points
NVIDIA Titan RTX
504.48 points
4 GPU
NVIDIA RTX 2080 Ti
926.34 points
NVIDIA Titan RTX
1235.83 points
VGG16 (FP32) 1 GPU
NVIDIA RTX 2080 Ti
178.65 points
NVIDIA Titan RTX
199.68 points
4 GPU
NVIDIA RTX 2080 Ti
452.2 points
NVIDIA Titan RTX
400.25 points
VGG16 (FP32 XLA) 1 GPU
NVIDIA RTX 2080 Ti
194.89 points
NVIDIA Titan RTX
218.47 points
4 GPU
NVIDIA RTX 2080 Ti
528.33 points
NVIDIA Titan RTX
559.34 points
3D, GPU Rendering Benchmarks 2024–2025 [Updated]↑ As of April 2025
V-Ray 1 GPU
NVIDIA RTX 2080 Ti
345 points
NVIDIA Titan RTX
382 points
Octane 1 GPU
NVIDIA RTX 2080 Ti
368 points
NVIDIA Titan RTX
377 points
Redshift 1 GPU
NVIDIA RTX 2080 Ti
8.38 minutes
NVIDIA Titan RTX
8.2 minutes
Blender 1 GPU
NVIDIA RTX 2080 Ti
3163.85 score
NVIDIA Titan RTX
3434.73 score
Luxmark 1 GPU
NVIDIA RTX 2080 Ti
33195 points
NVIDIA Titan RTX
36654 points
Unreal Engine 1 GPU
NVIDIA RTX 2080 Ti
30.1 FPS
Board Design NVIDIA RTX 2080 Ti NVIDIA Titan RTX Difference Length 11 in / 267 mm 11 in / 267 mm - Outputs 1x HDMI, 3x DisplayPort, 1x USB Type-C 1x HDMI, 3x DisplayPort, 1x USB Type-C - Power Connectors 2x 8-pin 2x 8-pin - Slot width Dual-slot Dual-slot - TDP 250 W 280 W 30 W (12%)
Clock Speeds NVIDIA RTX 2080 Ti NVIDIA Titan RTX Difference Boost Clock 1545 MHz 1770 MHz 225 MHz (15%) GPU Clock 1350 MHz 1350 MHz - Memory Clock 14000 MHz 14000 MHz -
Graphics Card NVIDIA RTX 2080 Ti NVIDIA Titan RTX Difference Bus Interface PCIe 3.0 x16 PCIe 3.0 x16 - Generation GeForce 20 GeForce 20 -
Graphics Features NVIDIA RTX 2080 Ti NVIDIA Titan RTX Difference DirectX 12 Ultimate (12_1) 12 Ultimate (12_1) - OpenCL 2 2 - OpenGL 4.6 4.6 - Shader Model 6.5 6.5 - CUDA 7.5 7.5 -
Graphics Processor NVIDIA RTX 2080 Ti NVIDIA Titan RTX Difference Architecture Turing Turing - Die Size 754 mm2 754 mm2 - GPU Name TU102-300A-K1-A1 TU102-400-A1 Process Size 12 nm 12 nm - Transistors 18600 million 18600 million -
Memory NVIDIA RTX 2080 Ti NVIDIA Titan RTX Difference Bandwidth 616 GB/s 672 GB/s 56 GB/s (9%) Memory Bus 352 bit 384 bit 32 bit (9%) Memory Size 11 GB 24 GB 13 GB (118%) Memory Type GDDR6 GDDR6 -
Render Config NVIDIA RTX 2080 Ti NVIDIA Titan RTX Difference ROPs 88 96 8 (9%) RT Cores 68 72 4 (6%) Shading Units/ CUDA Cores 4352 4608 256 (6%) TMUs 272 288 16 (6%) Tensor Cores 544 576 32 (6%)
Theoretical Performance NVIDIA RTX 2080 Ti NVIDIA Titan RTX Difference FP16 (half) performance 26.9 TFLOPS 32.62 TFLOPS 5.72 TFLOPS (21%) FP32 (float) performance 13.45 TFLOPS 16.31 TFLOPS 2.86 TFLOPS (21%) FP64 (double) performance 420.2 GFLOPS 509.8 GFLOPS 89.6 GFLOPS (21%) Pixel Rate 136 GPixel/s 169.9 GPixel/s 33.9 GPixel/s (25%) Texture Rate 420.2 GTexel/s 509.8 GTexel/s 89.6 GTexel/s (21%)
Price NVIDIA RTX 2080 Ti NVIDIA Titan RTX Difference MSRP $1,199.00 $2,499.00 $1,300.00 (108%) Release Date Sep 20th, 2018 Dec 18th, 2018
Test bench configuration NVIDIA RTX 2080 Ti NVIDIA Titan RTX Difference Hardware BIZON G3000 More details BIZON ZX5000 More details Software Deep learning: 3D Rendering: Deep learning: 3D Rendering: -

